 Hints:
If you need additional information about one of the clustering methods, click on its name and you will be redirected to a page with further details including an overview, how well this clustering method performs on different datasets.
Available clustering methods
Affinity Propagation (Details)
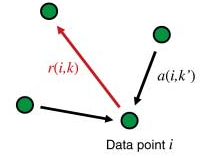 Affinity propagation performs the clustering by identifying exemplars (also called prototypes) among the available data points and reports their neighborhoods as clusters. It considers all data points as possible exemplars. The final set of exemplars is determined by sending messages between the data points voting for the best set of exemplars for the given similarity function in combination with the preference.
- Publication: Brendan J Frey and Delbert Dueck. Clustering by passing messages between data points. Science, 315(5814):972–976, Feb 2007.
DBSCAN (Details)
DBSCAN regards clusters of objects as dense regions that are separated by regions of low density. A certain minimum number of objects from each cluster is required to be within a certain distance. The number and the distance are user-given. Singletons are considered noise.
- Publication: Martin Ester, Hans peter Kriegel, Joerg S, and Xiaowei Xu. A density-based algorithm for discovering clusters in large spatial databases with noise. pages 226–231. AAAI Press, 1996.
DensityCut (Details)
densityCut is a novel density-based clustering algorithm, which is both time- and space-efficient. It first roughly estimates the densities of data points from a K-nearest neighbour graph and then refines the densities via a random walk.
- Publication: Jiarui Ding, Sohrab Shah and Anne Condon. densityCut: an efficient and versatile topologicalapproach for automatic clustering of biological data. Bioinformatics, 2016.
Hierarchical Clustering (Details)
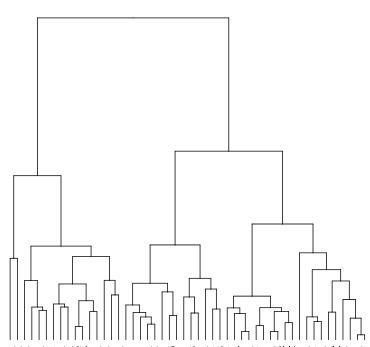 Hierarchical clustering creates a tree from a given set of objects. Each node in the tree represents a cluster. Agglomerative algorithms initially assign all objects to singleton clusters, which are merged based on their similarity (bottom-up). Divisive algorithms start with one big cluster, which is decomposed into smaller clusters along the tree (top-down). A linkage function determines the distance between two clusters. As linkage function, we use the Unweighted Pair Group Method using arithmetic Averages (known as UPGMA or average linking), which is probably the most popular algorithm for hierarchical clustering in computational biology
- Publication: R Core Team. R: A Language and Environment for Statistical Computing. R Foundation for Statistical Computing, Vienna, Austria, 2013. ISBN 3-900051-07-0.
MCODE (Details)
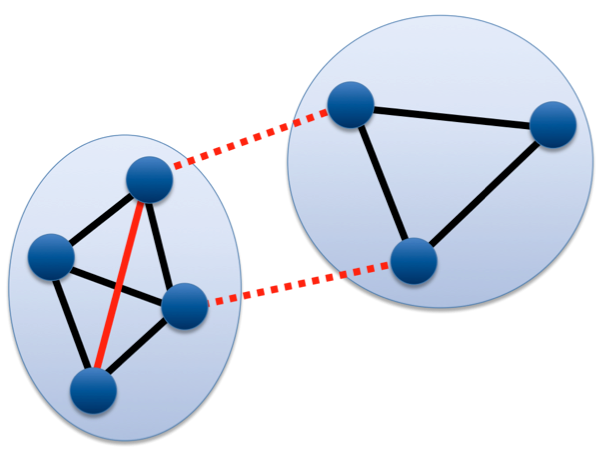
Molecular COmplex DEtection (MCODE) is a graph based clustering method. In a first step the ’cliquishness’-score of all nodes is measured by taking into account the number of vertices and edges in the direct neighborhood. In a second step, clusters are built by starting at the vertex with the highest score followed by a recursive growing of these clusters by adding all neighboring nodes exceeding a certain score. MCODE may become extremely slow on large connected components in the similarity graph.
- Publication: Gary D Bader and Christopher W V Hogue. An automated method for finding molecular complexes in large protein interaction networks. BMC Bioinformatics, 4:2, Jan 2003.
Markov Clustering (Details)
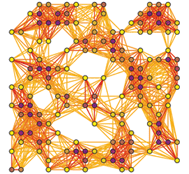 In Markov Clustering the input similarities are interpret as a graph on which densely connected areas are identified by simulating random walks. The clustering processes itself is performed by repeatedly alternating so-called expansion steps and inflation steps. The expansion steps allow simulated walks of long distances while the inflation steps sharpen the emerging local cluster structure.
- Publication: Stijn Dongen. A cluster algorithm for graphs. Technical report, Amsterdam, The Netherlands, The Netherlands, 2000.
Self Organizing Maps (Details)
Self Organizing Maps (SOMs) involve training a neural network, where each neuron represents one centroid. The number of centroids (or the grid size) is a user-given parameter reflecting the number of clusters. The SOM aims at finding a set of neurons/centroids and to assign each object to the neuron that approximates that object best while iteratively imposing a topographic ordering on the neurons by influencing neurons that are close by. The output is a set of neurons that implicate clusters (objects are assigned to the closest neuron/centroid).
- Publication: R. Wehrens and L.M.C. Buydens. Self- and super-organising maps in r: the kohonen package. J. Stat. Softw., 21(5), 2007.
Spectral Clustering (Details)
 Spectral clustering computes the second largest eigenvalue of the Laplacian of the similarity matrix to decide where to partition the similarity matrix. The resulting clusters may then be re-partitioned in order to generate a hierarchy. Efficient numeric algorithms solve the underlying linear algebra problems to facilitate spectral clustering on large datasets.
- Publication: Alexandros Karatzoglou, Alex Smola, Kurt Hornik, and Achim Zeileis. kernlab – an S4 package for kernel methods in R. Journal of Statistical Software, 11(9):1–20, 2004.
Transitivity Clustering (Details)
 Transitivity Clustering is based on the weighted transitive graph projection problem. A given similarity matrix is interpret as weighted graph and transformed into a so-called cost graph by removing edges weighted below a user-given threshold. Such a potentially intransitive graph is transformed into a transitive graph afterwards by adding and removing a minimal number of edges. Edge weights are taken into account by using a similarity-dependent cost function (the distance of the edge weight to the cutoff), which is to be minimized. A combination of exact and heuristic algorithms tackle this NP-hard problem. The number of clusters is influenced by the user threshold. The method guarantees that the mean similarity of objects within the same clusters is above the threshold, while the mean similarity between object from different clusters is below.
- Publication: Tobias Wittkop, Dorothea Emig, Sita Lange, Sven Rahmann, Mario Albrecht, John H Morris, Sebastian Boecker, Jens Stoye, and Jan Baumbach. Partitioning biological data with transitivity clustering. Nat Methods, 7(6):419–420, Jun 2010.
clusterONE (Details)
Clustering with Overlapping Neighborhood Expansion (ClusterONE) is a recently developed clustering method designed for detecting overlapping protein complexes in a given protein-protein interaction network. The primary concept behind the algorithm is the so-called cohesiveness measure, which is a combination of the number of reliable interactions within a cluster and the separation of the cluster from the rest of the network. We may apply ClusterONE to arbitrary data sets by transforming a given similarity matrix into a weighted similarity graph.
- Publication: Tamas Nepusz, Haiyuan Yu, and Alberto Paccanaro. Detecting overlapping protein complexes in protein-protein interaction networks. Nature Methods, 9(5):471–472, Mar 2012.
clusterdp (Details)
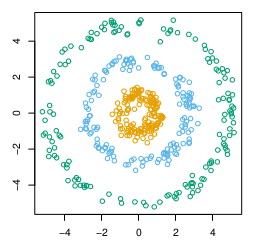
Clusterdp is a recently published tool based on the idea that centroids are characterized by a higher local density (rho) than their neighbors and by a comparably high distance from objects with higher density. Rodriguez and Laio claim that the number of clusters arises intuitively and that clusters are recognized regardless of their shape and dimensionality of the space in which they are embedded.
- Publication: A. Rodriguez and A. Laio. Clustering by fast search and find of density peaks. Science, 344(6191):1492–1496, Jun 2014.
fanny (Details)
Fanny is a fuzzy clustering method requiring a distance matrix and the desired number of clusters as input. Fanny aims to find for each object the best membership vector describing the degree of membership of each object to each cluster by minimizing the sum of the average within-cluster distances weighted by the degree of the membership. This objective function is minimized numerically and the nearest crisp-clustering is reported as result.
- Publication: Martin Maechler, Peter Rousseeuw, Anja Struyf, Mia Hubert, and Kurt Hornik. cluster: Cluster Analysis Basics and Extensions, 2012. R package version 1.14.3 — For new features, see the ’Changelog’ file (in the package source).
k-Means (Details)
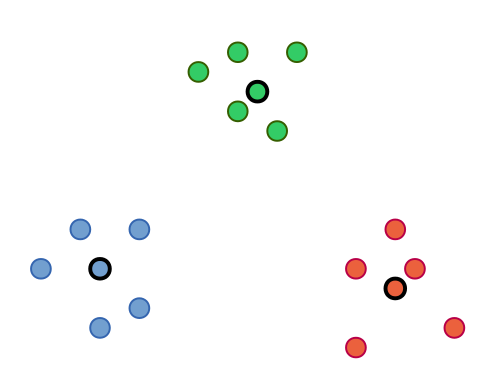
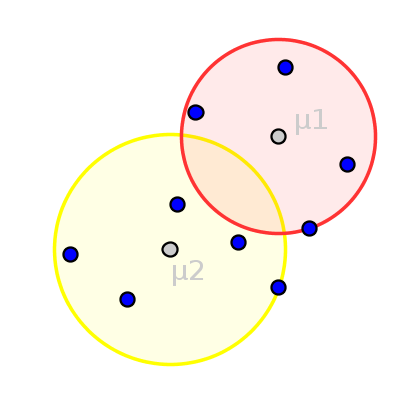 K-means might be the most well-known clustering algorithm. Using the number of clusters k as parameter, k-means aims to iteratively minimize the within-cluster-sum-of-squares by assigning each object to the closest centroid (an artificial object) followed by a subsequent update of these centroids. The assignment after the convergence of this process is reported as clusters.
- Publication: R Core Team. R: A Language and Environment for Statistical Computing. R Foundation for Statistical Computing, Vienna, Austria, 2013. ISBN 3-900051-07-0.
k-Medoids (PAM) (Details)
 In contrast to , Partitioning Around Medoids (PAM) is one of the most common realizations of the k-medoid clustering approach, which uses exemplars as cluster centers. The algorithm works identical to k-means except that the exemplars are updated by testing each object in each cluster as exemplar instead of calculating artificial mean objects (centroids).
- Publication: Martin Maechler, Peter Rousseeuw, Anja Struyf, Mia Hubert, and Kurt Hornik. cluster: Cluster Analysis Basics and Extensions, 2012. R package version 1.14.3 — For new features, see the ’Changelog’ file (in the package source).